SQL Graphs
Connections
The graph plots the number of database connections to each Transaction Engine (TE) stacked to arrive at the total number of connections at the top line.
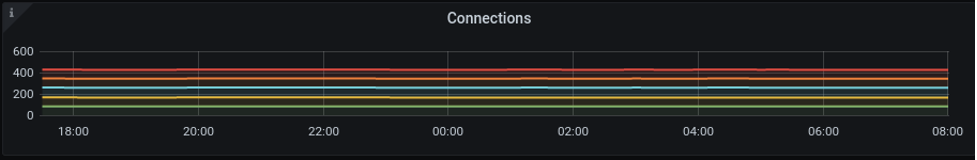
Use Case
The number of connections must be the same for all TEs. Increasing or decreasing the number of connections must be investigated. Typical applications would use connection pooling to manage the number and use of connections. Other methods may add variance to the number of connections per TE.
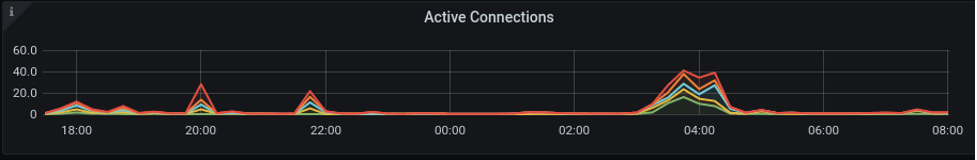
Active Connections
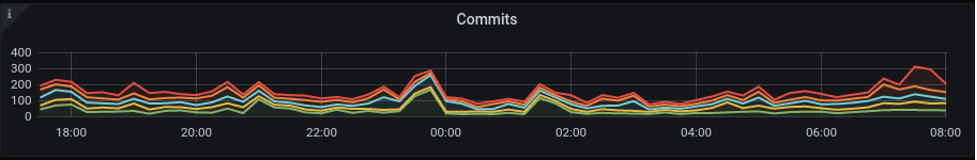
Commits
This graph plots the number of commits per second per TE. Each TE is represented by a different color. The graph is stacked, so the top line is the total number of commits per second.
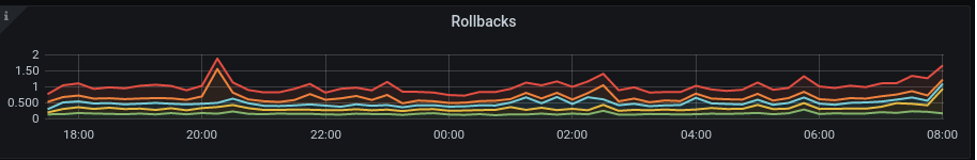
Rollbacks
This graph plots the number of SQL rollbacks per second per TE.
| Rollbacks are transactions that are deliberately rolled back and not committed. All rollbacks logged are not user-generated; some are database generated. |
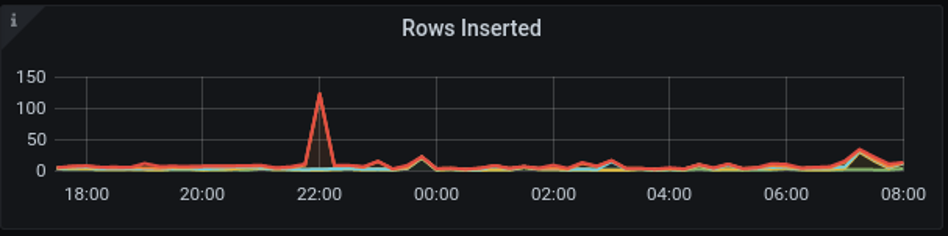
Rows Inserted
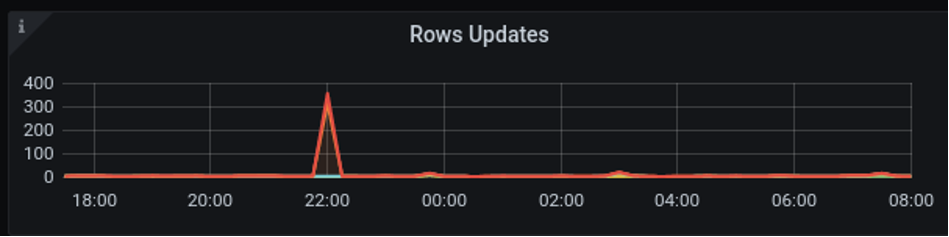
Rows Updated
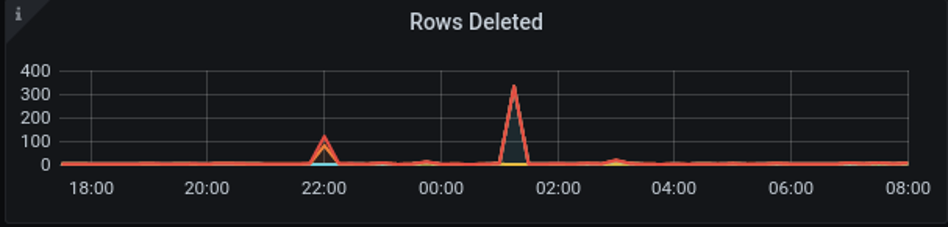
Rows Deleted
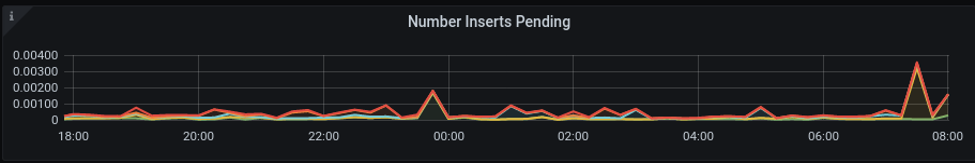
Number Inserts Pending
This graph plots the time spent waiting for inserts to be completed.
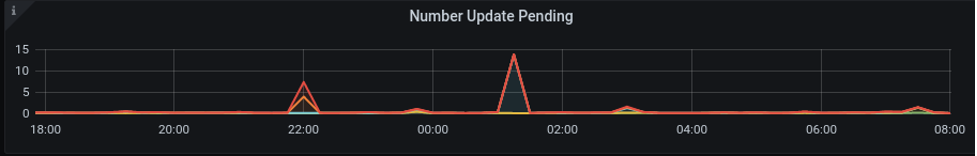
Number Updates Pending
This graph plots the time spent waiting for updates to be completed.