Memory Graphs
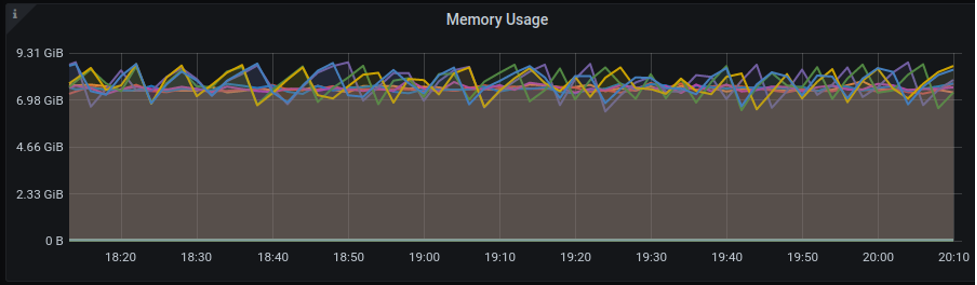
Memory Usage
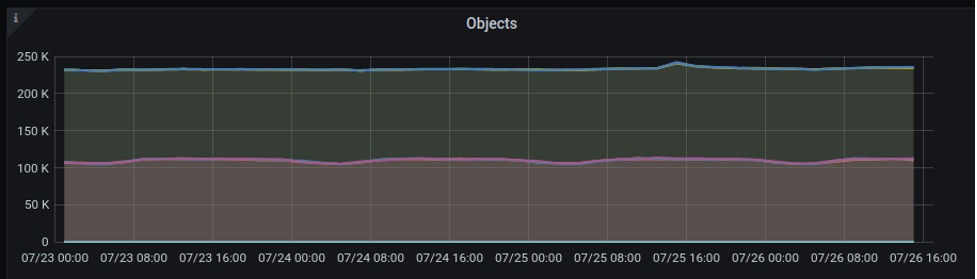
Objects
Objects are atoms in memory. This line graph plots the number of atoms in memory for each TE and SM.
Use Case
Ideally, the number of atoms in the SM is one to two times the number of atoms in the TE, as the SMs have a copy of all the TE’s atoms in memory. However, there could be more objects in the SM as they attempt to cache all disjoint atoms in memory in the TE. Depending on the schema and the working set, the number of atoms in the SM could vary. A higher number of atoms in an SM can be further investigated by reviewing the disk statistics.
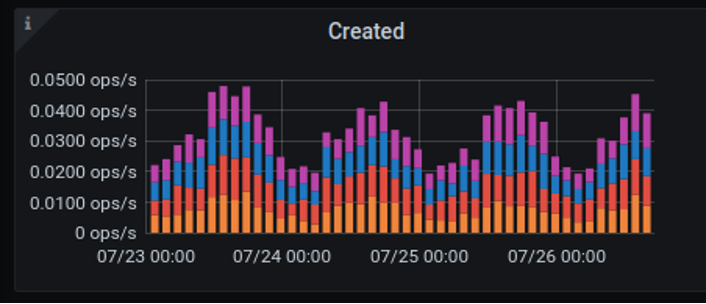
Objects Created
This stacked column graph represents the number of atoms created in memory on each TE over time. Each color represents a different TE.
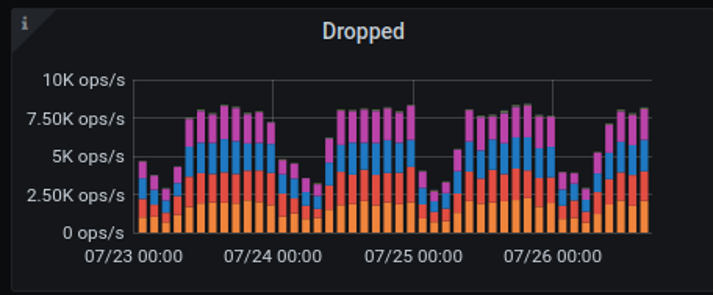
Objects Dropped
This stacked column graph represents the number of atoms dropped from the memory. These atoms may no longer be in memory but could still be in durable storage. Each color represents a different TE or SM.
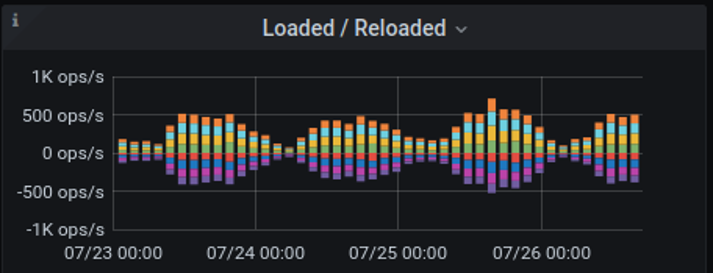
Loaded/Reloaded
This stacked column graph condenses information for SMs only. It shows the number of atoms in memory in the SMs that are loaded or reloaded from the storage. The top quadrant shows the loaded objects for each SM. The bottom quadrant shows the Reloaded objects or purged state objects loaded from durable storage.
Use Case
The Loaded graph indicates the number of atoms being loaded into memory from the disk. The Reloaded graph indicates the number of atoms being retrieved from the disk to SM memory after previously being purged. Ideally, the graph should be almost the same for each SM and no color should dominate.
If reloading of purged atoms in memory happens frequently, it may indicate that SM memory is too small for the workloads in the TEs.
| Purged atoms are atoms where the SM memory garbage collection has marked the atom in memory as not being part of a transaction and is currently cached in at least one TE. |
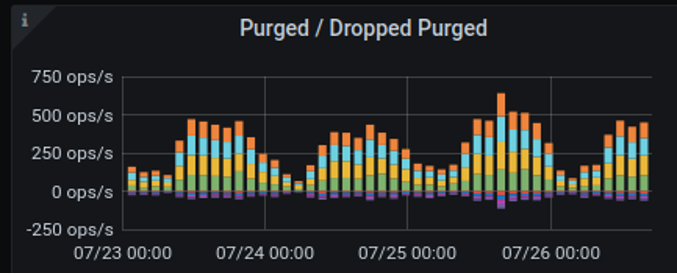
Purged/PurgedDropped
This stacked column graph condenses information for SMs only.
The top quadrant shows the number of ObjectsPurged atoms in memory.
ObjectsPurged atoms are where the SM memory garbage collection has marked the atom in memory as not being part of a transaction and is currently cached in at least one TE.
The bottom quadrant shows the number of ObjectsPurgedDropped atoms in memory.
ObjectsPurgedDropped atoms are where the purged atom is dropped from memory in all SMs and TEs.
Use Case
If purged atoms in memory are being reloaded at the same rate, that indicates that the SM’s memory is not large enough to handle its workload. Purged atoms in memory should become purged Dropped when the SM memory is more optimally specified. If TEs are dropping frequently and requesting atoms in memory while the application workload remains constant, then performance can likely be improved by adding memory to the TE.
| The minimum ratio of purged atoms in TE to SM is 1:1. However, it may increase to 2.5:1 in favor of the SM depending on the workload type. If the SM is experiencing many reloads because of a high write workload, then increasing SM memory may help because the database would not have to reload before write if the SM has to purge fewer atoms. |
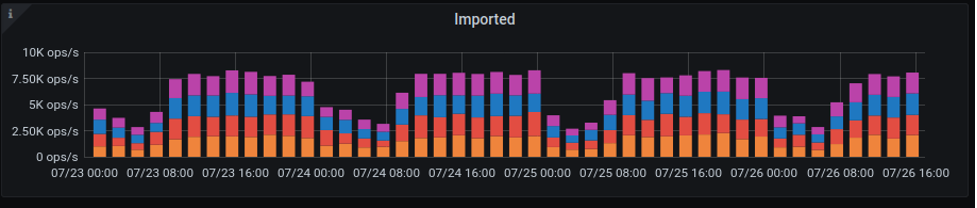
Imported
This stacked column graph plots the number of atoms in memory imported into an SM or a TE.
Use Case
Atoms in memory of a TE and SM will be imported to every other TE and SM. Every TE or SM is represented by a different color. No color should dominate for long. Ideally, this graph should mirror the Exported graph, depending on domain layout and workload.
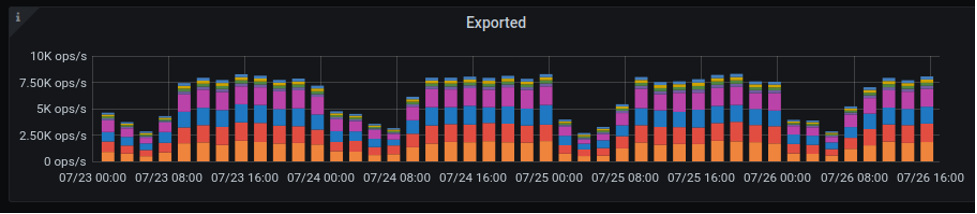
Exported
This stacked column graph plots the number of atoms in memory exported from an SM or a TE.