NuoDB Ops System Overview Graphs
This series of graphs are a collection of duplicate graphs for overview purposes.
Memory usage
This graph is a duplicate of the Memory usage graph.
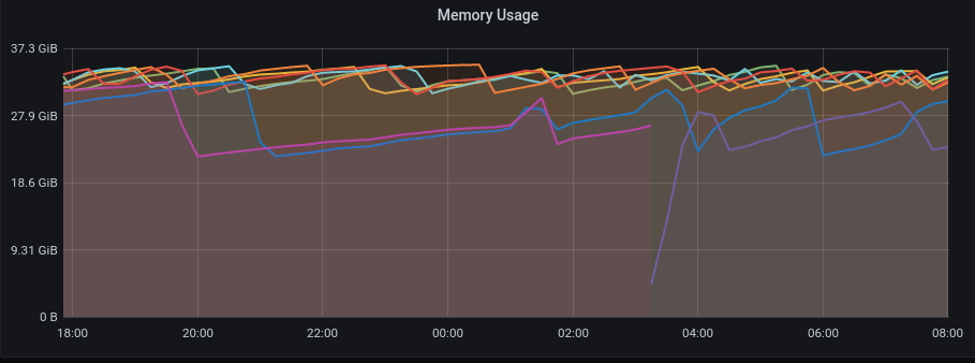
Figure 1. Memory usage
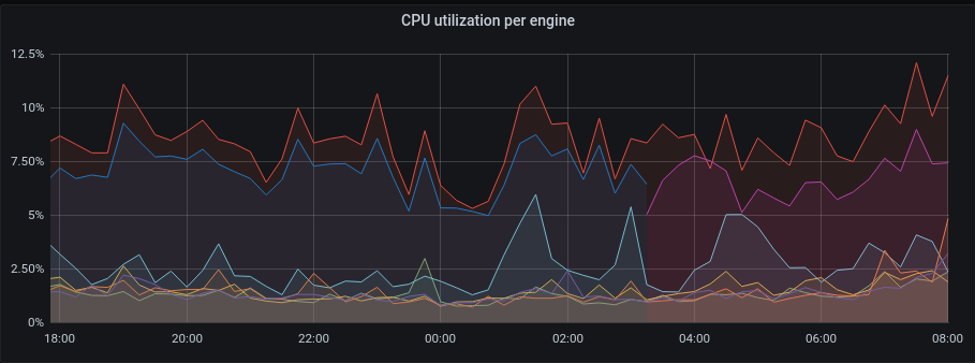
CPU utilization per engine
Transaction rate
This graph plots the rate of transactions committed per second. This is similar to Commits in SQL group of graphs.
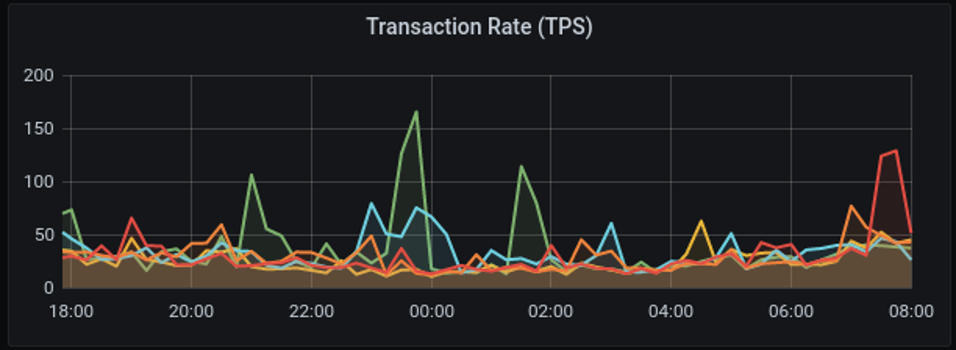
Figure 3. Transaction rate
Aggregate transaction rate
The sum of all the transactions per second across all TEs and the total number of TEs.
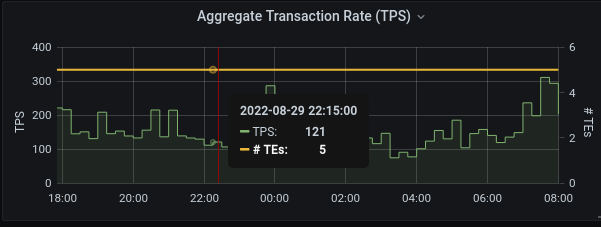
Figure 4. Aggregate Transaction rate