CPU Graphs
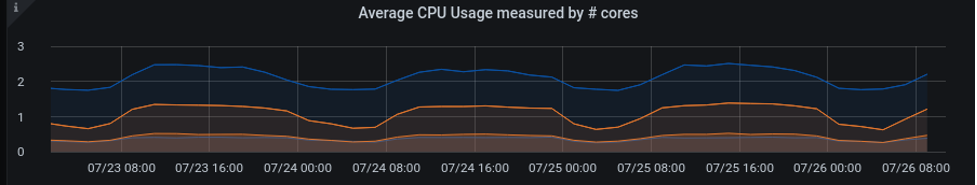
Average CPU usage measured by the number of cores
This line graph plots the total CPU time, User CPU time, and System CPU time in units of cores for all Transaction Engines (TEs) and Storage Managers (SMs).
Use Case
The total CPU time, User time, and System time for SMs and TEs are represented by different colors.
Ideally, User time should be greater than System time and total time should be less than total CPU cores.
Graph Creation Details
To create a graph using other tools, use the following details:
-
TE Total: for ncores of
PercentCpuTimefiltered by TEs, average -
TE User: for ncores of
PercentUserTimefiltered by TEs, average -
TE System: for ncores of
PercentSystemTimefiltered by TEs, average -
SM Total: for ncores of
PercentCpuTimefiltered by SMs, average -
SM User: for ncores of
PercentUserTimefiltered by SMs, average -
SM System: for ncores of
PercentSystemTimefiltered by SMs, average
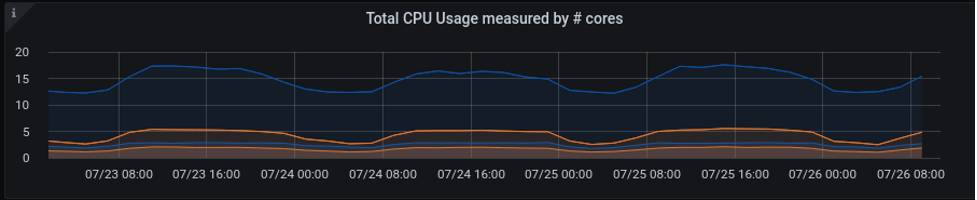
Total CPU Usage measured by number of cores
This line graph plots the total CPU usage, User CPU usage, and System CPU usage each added together to indicate total CPU usage in number of cores.
Use Case
Total CPU time, User time, and System time for SMs and TEs are represented by different colors.
Ideally, User time should be greater than System time and total time should be less than total CPU cores.
Graph Creation Details
To create a graph using other tools, use the following details:
-
TE Total: (sum of ncores)/TE’s of
PercentCpuTimefiltered by all TE’s process, sum -
TE User: (sum of ncores)/TE’s of
PercentUserTimefiltered by all TE’s process, sum -
TE System: (sum of ncores)/TE’s of
PercentSystemTimefiltered by all TE’s process, sum -
SM Total: (sum of ncores)/SM’s of
PercentCpuTimefiltered by all SM’s process, sum -
SM User: (sum of ncores)/SM’s of
PercentUserTimefiltered by all SM’s process, sum -
SM System: (sum of ncores)/SM’s of
PercentSystemTimefiltered by all SM’s process, sum
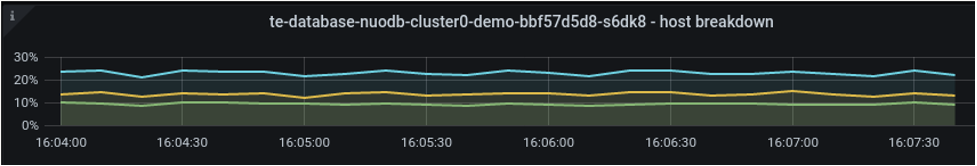
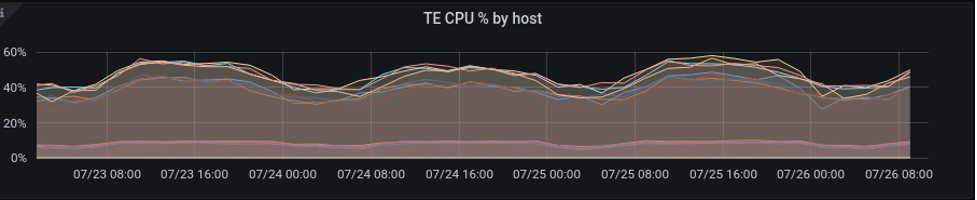
Average CPU percentage by Host for TEs
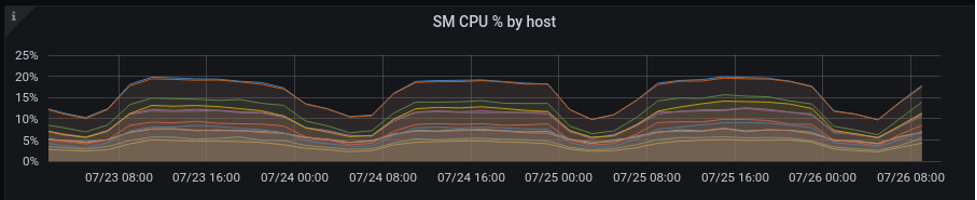
Average CPU Percentage by Host for SMs
This line graph shows the average CPU usage, in percentage, by host for SMs.