Case Studies
This section has several examples of real-world situations where NuoDB Insights is used to monitor overall database health.
Degraded performance
Problem Description
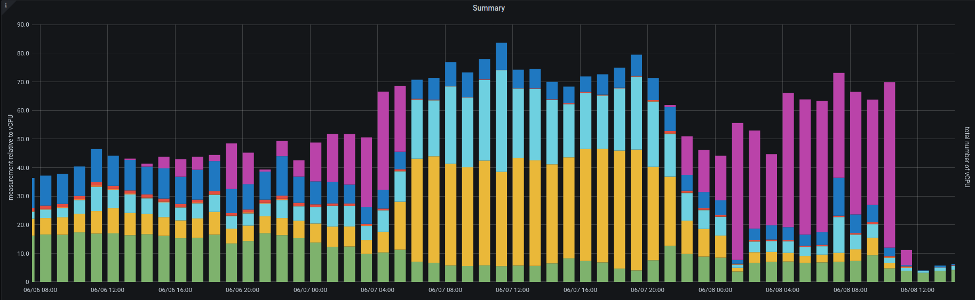
The user complained of degradation of performance from around 01:00 hours.
Analysis
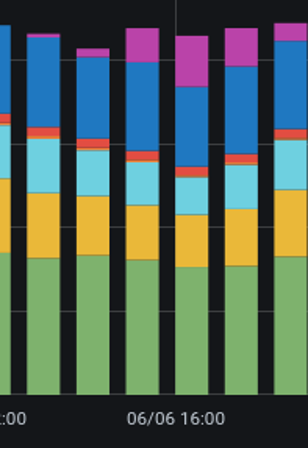
Throttling (magenta) occurred much earlier than 01:00 hours, starting from about 13:00 hours the previous day.
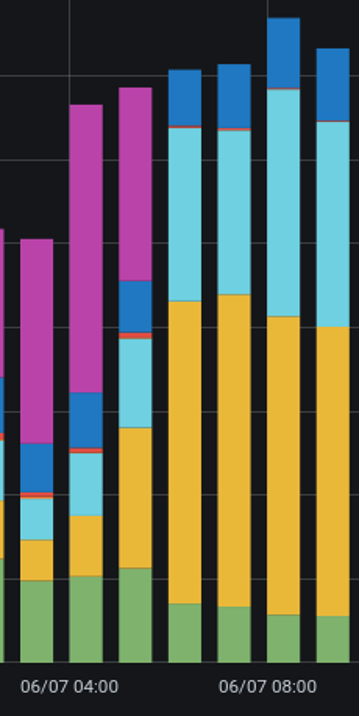
Throttling (magenta) continued to be a larger part of each measurement time slice, until around 06:00 hours, where durable commits (yellow) started to take much longer to get acknowledged.
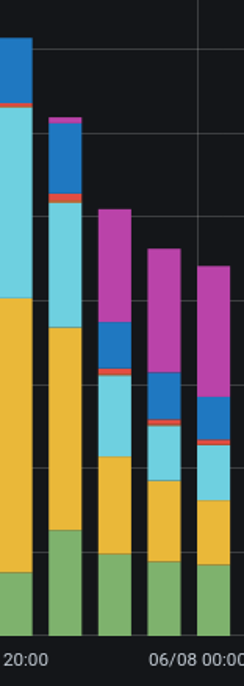
Throttling (magenta) takes over again from 22:00 hours until the load is reduced at 11:00 hours.
One slow disk
Analysis
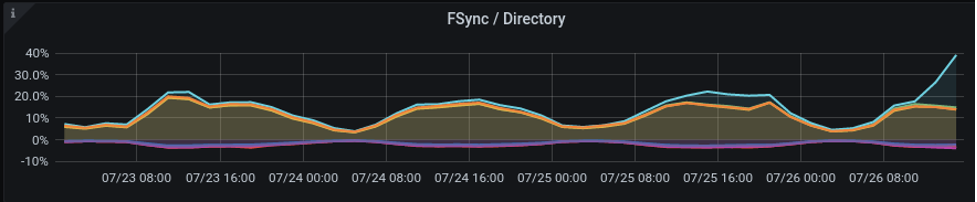
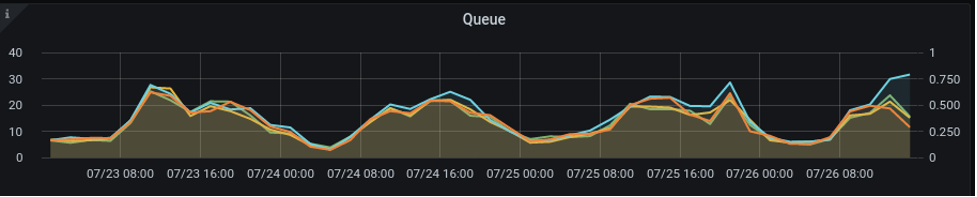
The fsync time increasing for the light blue line indicates more time taken to write the same data. The archive queue is increasing for the light blue line. This indicates the Storage Manager (SM) and Transaction Engine (TE) lengthening the queue due to slow data write-speed.
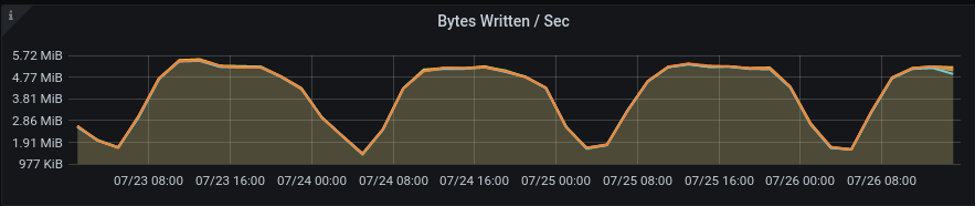
The light blue line on the Bytes Written Per Second graph, shows a decrease.
Underperforming SSD disks
Analysis
Fsync graph showing long periods of high usage of fsync which impacted performance. A closer inspection reveals that the periods of low fsync happened after long periods of SM downtime.
Conclusion
It was observed that the maintenance program for SSDs had not been activated and the SSDs were suffering from write amplification. Long periods of downtime allowed the disk’s garbage collection to be run to recover performance. An example of a maintenance program might be fstrim on a cron job during low utilisation periods.