Communication Graphs
Sent Rate of Data
This line graph plots the number of bytes sent from each Storage Manager (SM) and Transaction Engine (TE).
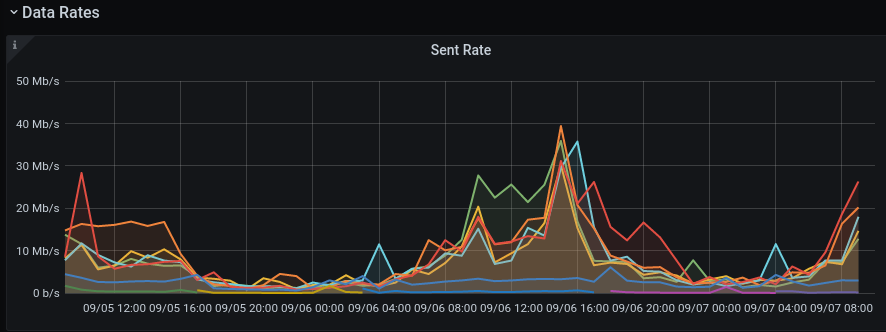
Figure 1. Sent Rate of Data
Received Rate of Data
This line graph plots the number of bytes received by each SM or TE.
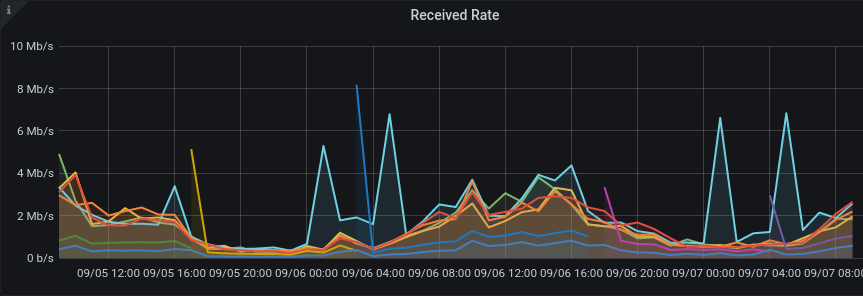
Figure 2. Received Rate of Data
Sent Rate of Messages
This line graph plots the number of messages sent per SM and TE. Each message may have a variable data payload.
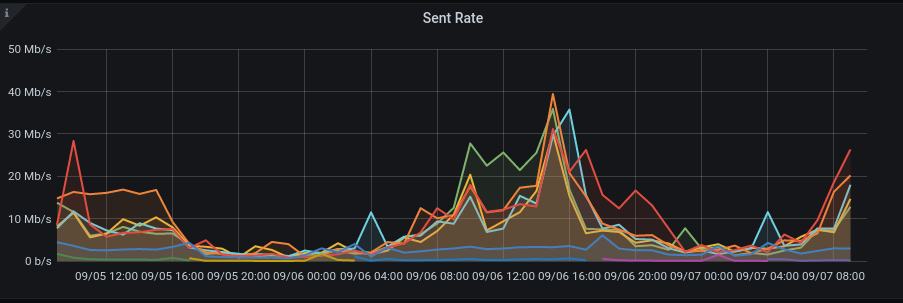
Figure 3. Sent Rate of Messages
Received Rate of Messages
This graph plots the number of messages received per SM and TE. Each message may have a variable data payload.
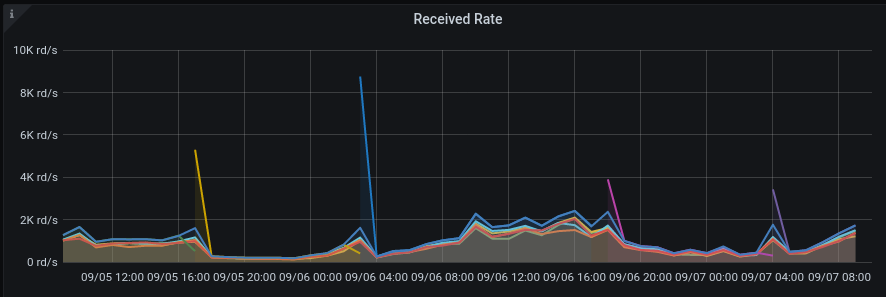
Figure 4. Received Rate of Messages