Disk Graphs
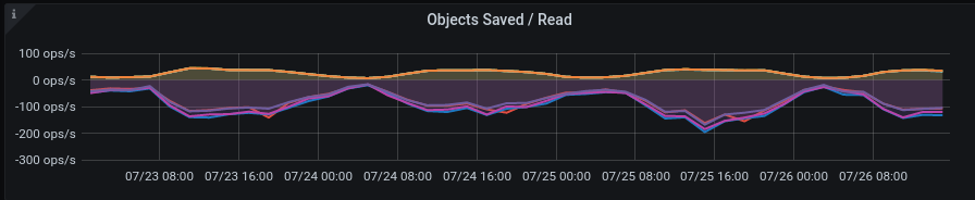
Archive Objects Saved/Read
This line graph plots the number of atoms in memory saved to the archive on disk and the number of atoms requested and loaded into memory from the archive on disk for the Storage Manager (SM). Each line represents the saving and loading of an SM or a Transaction Engine (TE).
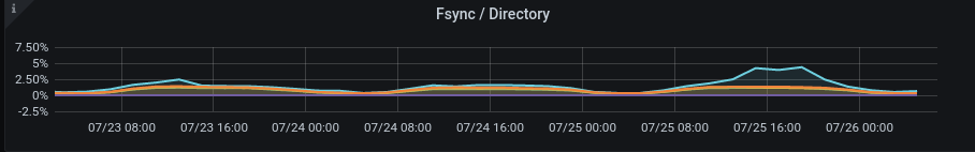
Fsync/Directory
This graph plots data for SMs only for archive writing, the amount of time in file synchronizing with atoms in memory onto disk and the amount of time spent interacting with the operating system for directory and file admin.
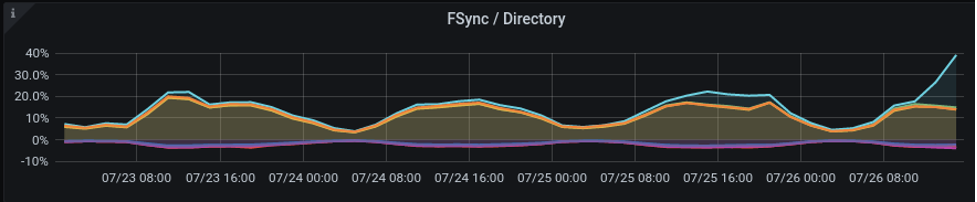
Use Case
Even one slow disk can impact overall performance. While the time spent to write to disk should trend towards zero, a high workload will increase the time to write to disk. Any line consistently above 30—40% of measurement must be investigated. Any lines that are not in line with the other lines or approach max fsync must be investigated. Typical failures include misconfigured disks or under performing disks. Directory time should be a very small percentage of the total time.
File sync (fsync) instructs the Operating System (OS) to save directly to disk and not to store in disk buffers.
This is to prevent data loss in the event of a system failure like power loss, memory failure, OS crash, and so on.
|
Queue
This line graph plots the number of SM-only archive atoms in memory to be saved to disk.
| The thin red line graph representing the write throttle statistic is zero in this example. |
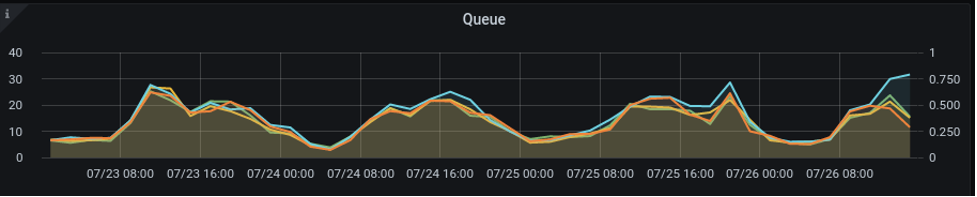
Use Case
There will always be a queue of atoms in memory to be saved to disk. NuoDB process threads will regularly search the queue of atoms. More workload will have a higher queue. Look for lines outside the average.
| A thin red line indicates a write throttle which happens when the number of atoms in memory to write to disk exceeds the write speed of the SM onto disk. |
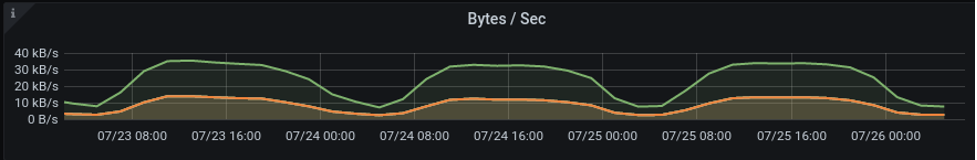
Bytes Written Per Second
This line graph plots the number of archive bytes written to disk per second.
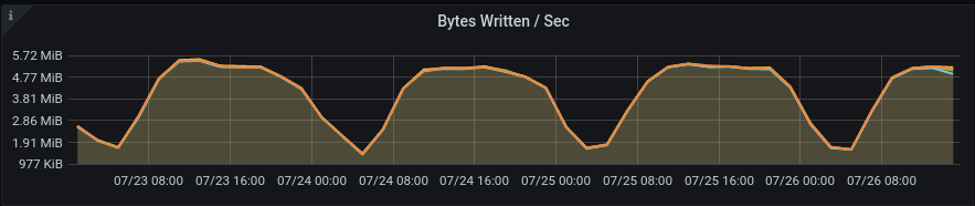
Use Case
This graph must be read in conjunction with others. A decrease in the number of bytes written with corresponding increases in queue length and Fsync graphs must be investigated. Another example of failure would be a visible flat line, indicating some maximum performance limit. Any disparity between the lines would indicate performance issues with a disk. These signs would indicate an issue with disk IO that may need investigation.
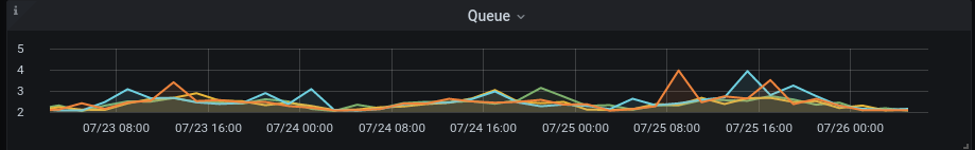
Journal Queue
Journals protect from sudden system failures such as memory failure, OS crashes, or power loss. Once a transaction is committed, it is written to a journal disk but not to the archive. Writing to a journal should be quicker as the write size is smaller and the burst capacity of disks should be higher. If the system fails, no transactions are lost since they are recorded in the journal. On restart, the SM runs all the transactions in the journal first and updates the archive accordingly. Once a transaction in the journal has been written to the archive disk, the associated journal messages are reaped (removed) from the journal disk. If an atom has been modified several times in a short period, multiple deltas of the atom will be in the journal, one for each change. The reaping operation will skip earlier versions and only write the most recent copy of the atom from the journal into the archive.
This line graph plots the number of messages ready to write to disk.
Fsync and Directory
This line graph plots the time taken to sync files to disk and directory admin.
Use Case
Disk performance issues can show up in increased fsync times and directory admin times. Check past performance to indicate issues. A single color should not dominate. Max fsync for journals is 100%. Any lines that are not in line with each other, or approach max fsync may need investigation. Typical failures include misconfigured disks or underperforming disks. Directory admin should be a very small percentage of the total time.
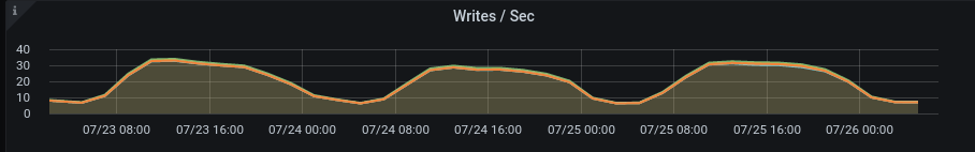
Writes Per Second
This line graph plots the number of journal messages written to disk for each SM.