Monitor using NuoDB Insights
| NuoDB Insights is deprecated in 8.0 and later. |
NuoDB Insights is an application monitoring tool for monitoring the health, resource consumption, workload, and performance of NuoDB databases. It provides real-time insights into database performance, errors and usage, helping users to identify and resolve problems, manage infrastructure, or review capacity planning. It uses open-source software such as Telegraf, InfluxDB, and Grafana, to collect raw metrics produced by the database or other sources, and condenses them into intuitive graphical display dashboards.
NuoDB Insights installs locally on the same nodes or hosts on which your database runs, and it supports all NuoDB database deployment environments. It can be installed before or after the database startup.
An application monitoring system consists of three core components:
-
Collector daemon(s) to gather metrics
-
Time Series Database to store real-time, high-rate metrics
-
Query/Visualization to enable visual monitoring and root cause analysis
Generating an information-dense graph of useful information from raw NuoDB statistics is done by stages of aggregation and filtering. NuoDB Collector, an automated, cloud-based data collection and analytics tool, utilizes the open-source collector, Telegraf. Telegraf performs some data processing to generate aggregate or average statistics before sending them to a time series database (such as InfluxDB or Prometheus) or to data aggregation services (such as Datadog or Sumo Logic).
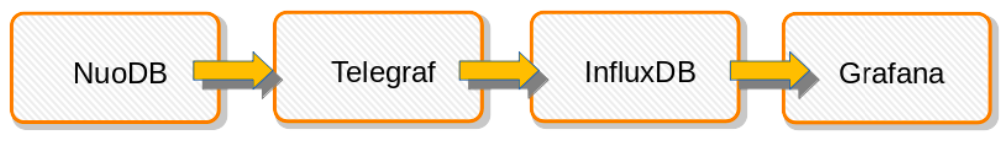
Grafana, the visualization tool, performs further filtering and averaging to condense the information into a graph.
The statistics generated by Telegraf under various labels are available in the InfluxDB database as selectable database columns for graph generation.
The raw NuoDB statistics can also be generated to a local file using the nuocmd get stats command.
This section provides information to assist with interpreting the NuoDB metrics, describes important data points, and provides case studies on how to use NuoDB metrics using off-the-shelf software tooling, such as Grafana. NuoDB metrics can also be used with Sumo Logic and Prometheus.
Use NuoDB Insights with Grafana graphs
This section covers the Grafana graphs and what they indicate. The reasons for performance issues in NuoDB can be spotted by comparing the performance metrics with the performance during normal operations.
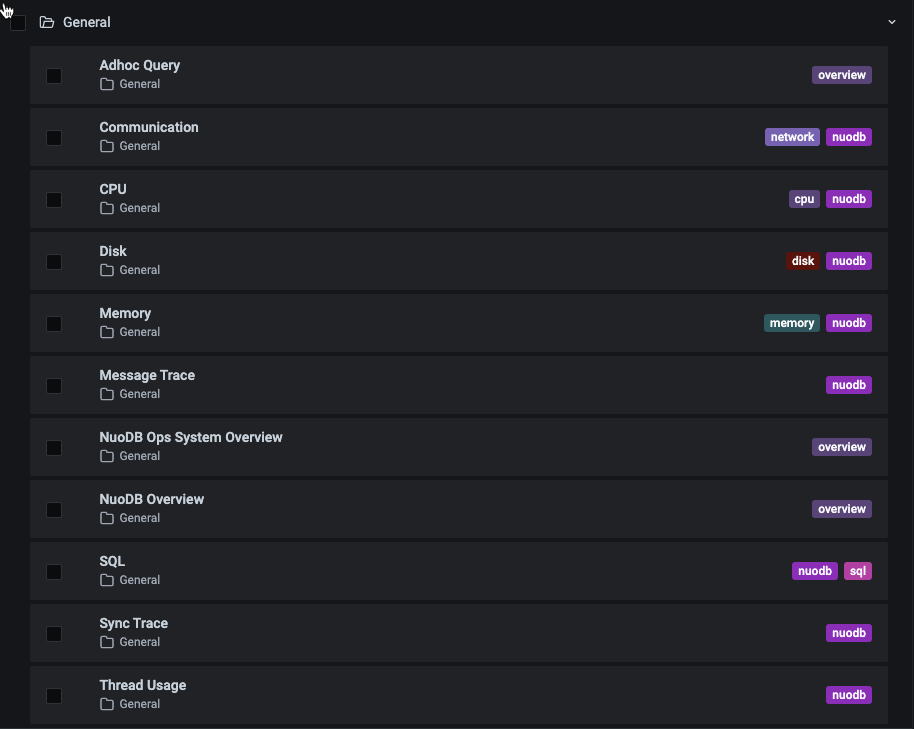
Sign in to Grafana and on the side menu, select to view the existing dashboard folders.
It includes pre-built dashboards to monitor and visualize the performance of NuoDB metrics.
| Further navigation aids are available on the top right menu on each dashboard. User-supplied screen refresh (in seconds) and date, and time interval values can be configured from this location. |